FREE FLOW OF INFORMATION
An analysis by Roger Stoll reprinted by the Transcend Media Service
“In general, in a deep conflict, the eyes of the downtrodden are more acute about the reality of the present.” – Immanuel Wallerstein (The Modern World System, Introduction, p. 4)
Introduction
22 Apr 2022 – On April 7 the UN General Assembly (UNGA) passed a resolution intended to signal support for the US/NATO effort in Ukraine. This gesture of support came in the form of a resolution removing Russia from its seat on the UN Human Rights Council (UNHRC).1 Just as with the March 2 UNGA resolution condemning Russia’s military intervention of February 242 (passed by countries representing just 41% of world population3), the April 7 vote is dizzyingly lopsided. Western media presented passage of both resolutions as victories. But when adjusted for world population, these votes appear as popular losses for US/NATO and its sphere. The April 7 resolution had support from countries representing just 24% of global population, a drop of 17% from the March 2 vote and an even more striking popular defeat for US/NATO.4
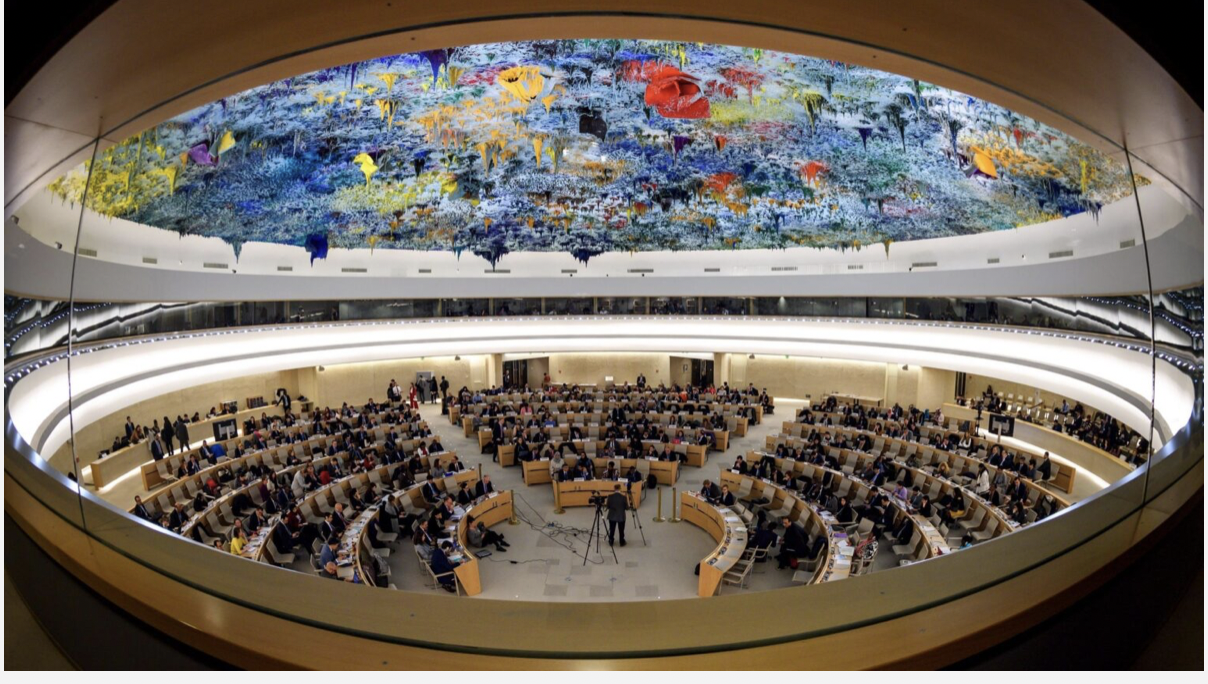
The United Nations Human Rights Council in Geneva
The April 7 Vote to Remove Russia From the UN Human Rights Council
Here is the result of the April 7 vote to remove Russia from the UNHRC:
93 IN FAVOR
24 AGAINST
58 ABSTENTIONS
18 NOT VOTING
(TOTAL: 193 COUNTRIES)
If you count people instead of countries, the vote means that countries representing only 24.33% of the world’s population voted in favor of the resolution, with 75.67% of humanity’s nations voting AGAINST, ABSTAINING, or NOT VOTING:
VOTING FOR THE RESOLUTION: 24.33%
AGAINST, ABSTAINING, OR NOT VOTING: 75.67%
(AGAINST 27.52%; ABSTENTIONS 45.17%; NOT VOTING 2.98%)5
Just as with the March 2 vote to condemn the February 24 Russian intervention in Ukraine, the April 7 vote divides richer from poorer countries and “white countries” from “countries of color.” For both the March 2 and the April 7 votes, when adjusted for population, the great majority of richer “white countries” voted with US/NATO, and the great majority of poorer “countries of color” did not.
Much popular sentiment in US/NATO countries and their sphere, including on the Left, condemns Russia’s intervention. But judging by these two recent United Nations General Assembly votes, world opinion seems contrary, especially among governments of countries that are poorer, “of color,” and in the global periphery or semi-periphery of the world system.
There have been many official government statements contradicting condemnations of Russia from the Global North. Two came from Cuba and Nicaragua, countries which happen to fit the profile just given. But this article will not consider such statements, nor add to the reams of gigabytes filled with discussion of the merits or demerits of Russia’s intervention, war crimes in Ukraine and questions as to who might have committed them, Russia’s intentions expressed or unexpressed, nor who, if anyone, is winning or losing the war.
Instead I will try to analyze the demography of the April 7 UNGA vote to remove Russia from the UNHRC.
The Wealth and Color of Nations: Definitions
Before analyzing the vote, and for the purpose of this article, I want to make a picture of the world in over-simplified economic and racial terms, and define my terms “poorer countries,” “richer countries,” “countries of color,” and “white countries.” I will also use the established terms of world-system theory, “core,” “periphery” and “semi-periphery.”6
Wealth
First, to get some idea of what a “wealthy country” might be, I’ll compare nominal GDPs per capita (GDPcn). Instead of the four national income categories used by the World Bank, I’ll put all countries into just two groups based on GDPcn. I’ll call “richer” any country with a GDPcn of $13,000 or above. All other countries I’ll call “poorer.” This means:
85% of the world’s population lives in “poorer countries
15% of world population lives in “richer countries.”7
Here are some examples of countries in each group. In the list I rely on, Luxembourg is the richest country in the world with a GDPcn of $131,782; South Sudan is the poorest country in the world with a GDPcn of $315. “Poorer countries” include Ethiopia $952, China $11,819, Russia $11,654, Vietnam $3,609. “Richer countries” include some with GDPcn’s that are multiples of China’s or Russia’s, like France $44,995; Germany $51,860; Japan $42,928; United Kingdom $46,344; United States $68,309.
Color
I will call countries that are predominantly inhabited by or dominated by people North Americans generally (but inconsistently) perceive as “of color,” “countries of color.” (See Appendix 2.) All others I’ll call “white countries.” This means:
85% of world population lives in “countries of color.”
15% lives in “white countries.”
Core vs. Periphery (& Semi-Periphery)
World-systems theory puts the global wealth split into relief, dividing the nations of the world into the “core” and “periphery” of the global system. In world-systems theory the surplus value of labor flows disproportionately from the periphery to the core: “The countries of the world can be divided into two major world regions: the ‘core’ and the ‘periphery.’ The core includes major world powers and the countries that contain much of the wealth of the planet. The periphery has those countries that are not reaping the benefits of global wealth and globalization.” (Colin Stief, ThoughtCo.com, 1/21/20) The core countries include most of the richest and most powerful countries, historically and currently.
Here are the core countries, each followed by its GDPcn: Australia $62,723, Austria $53.859, Belgium $50,103, Canada $49,222, Denmark $67,218, Finland $54,330, France $44,995, Germany $51,860, Greece $19,673, Iceland $65,273, Ireland $94,556, Israel $47,602, Italy $33,190, Japan $42,928, Luxembourg $131,782, Netherlands $58,003, New Zealand $47,499, Norway $81,995, Portugal $25,065, Singapore $64,103, Spain $30,996, Sweden $58,997, Switzerland $94,696, United Kingdom $46,344, United States $68,309.
Here is the distribution of population between core and periphery:
88% of world population lives in countries in the periphery (or semi-periphery)8
12% of world population lives in core countries
Intersection of Wealth and Race
Looking at the world through these categories of wealth, race, core and periphery (including semi-periphery), this is what we see (rounded):
“Poorer” “countries of color” have 82% of world population.
“Poorer” “white countries” have 3% of world population.
“Richer” “countries of color” have 3% of world population.
“Richer” “white countries” have 12% of world population.
Using the core/periphery (& semi-periphery) analysis:
2% of the world population living in “countries of color” live in the core nations.
71% of the world population living in “white countries” live in the core nations.
Both analyses show the world sharply divided between its great majority of “countries of color” concentrated among the “poorer countries” and a small global minority of “white countries” constituting most of the “richer countries.” This is important to the following discussion of the UNGA vote on the April 7 resolution.
The UN Vote by Share of World Population
Here again are the results of the April 7 vote to remove Russia from the UNHRC, given by share of world population, not country:
VOTING FOR THE RESOLUTION: 24.33%
AGAINST, ABSTAINING, OR NOT VOTING: 75.67%
(AGAINST 27.52%; ABSTENTIONS 45.17%; NOT VOTING 2.98%)
For simplicity, I’ll round off the numbers, and reduce the vote to two categories: YES and NAN (No; Abstention; Not voting):
24% YES
76% NAN
The Vote and the Wealth, Color and World System Status of Nations
The point of this article is to demonstrate both how little global support there is for the US/NATO position in Ukraine, and also to show just how much the results of the April 7 vote split the world along the lines of the reigning global hierarchies of populations and nations. (Dear reader, I think this blizzard of statistics is worth suffering through.)
1. The Vote by “Poorer” and by “Richer” Countries, by Population
“Poorer countries” declined to support the resolution roughly 9 to 1, while richer countries supported the resolution more by than 30 to 1:
All “poorer countries”:
11% YES
89% NAN
All “richer countries”:
97% YES
3% NAN
2. The Vote by “Countries of Color” and by “White Countries,” by Population
The racial divide is almost as extreme as the wealth divide. “Countries of color” declined to support the resolution by more than 6 to 1, while “white countries” supported it by a nearly identical margin:
All “countries of color”:
13% YES
87% NAN
All “white countries”:
86% YES
14% NAN
3. The Vote by Core and Periphery (& Semi-Periphery), by Population
The periphery overwhelmingly declined to support the resolution, while the core was virtually unanimous in support of it:
All peripheral (& semi-peripheral) countries:
13% YES
87% NAN
All core countries:
99% YES
1% NAN
(Article continued in the column on the right)
Free flow of information, How is it important for a culture of peace?
(Article continued from the column on the left)
4. The Vote by Intersectional Categories of Race and Wealth, by Population
In this series of statistics the YES vote rises from only 10% for “poorer” “countries of color” to a unanimous 100% for “richer” “white countries,” while the NAN vote, of course, drops from 90% to zero.
All “poorer” “countries of color”:
10% YES
90% NAN
All “poorer” “white countries”:
33% YES
67% NAN
All “richer” “countries of color”:
75% YES
25% NAN
All “richer” “white countries”:
100% YES
0% NAN
5. The Vote by Intersectional Categories of Race and Wealth in the Core and Periphery (& Semi-Periphery), by Population
Again, notice how the YES vote rises from 11% for “countries of color” in the periphery, to a unanimous 100% for “white countries” in the core.
All “countries of color” in the periphery (& semi-periphery):
11% YES
89% NAN
All “white countries” in the periphery (& semi-periphery):
53% YES
47% NAN
All “countries of color” in the core:
95% YES
5% NAN
All “white countries” in the core:
100% YES
0% NAN
Conclusion
These numbers show the global divides of wealth, color, core and periphery deeply etched in the April 7 UNGA vote.
Here is a possible explanation.
The war in Ukraine is not just a conflict in Eurasia between two countries. Nor is it only a contest between two power blocks, with the US and its sphere on one side, and Russia and its sphere on the other. It may be that this conflict concerns unequal and contested economic, political and social relations between all nations and peoples of the world. Economist and economic historian Michael Hudson sees the contest as part of a clash of economic systems, between US-led neoliberal finance capitalism and socialist industrialization led by Russia, China and Eurasia.
What is clear is that with this UNGA vote the nations representing most of the downtrodden of the world have acted in defiance of US/NATO demands, pressure, and inordinate power.
Appendix 1: UN Countries (193)
Here are each of the countries on the UNGA roster for April 7, 2022, followed by its GDPcn, world population share, and vote (YES, NO, abstention [AB], not voting [NV]). GDPcn numbers are from a compilation of International Monetary Fund statistics for 2021 and, where noted, statistics from the World Bank (WB) or the United Nations (UN).
Afghanistan $592 (0.5%) NV; Albania $5,991 (0.04%) YES; Algeria $3,364 (0.56%) NO; Andorra $40,886 (WB 2019) (0.00%) YES; Angola $2,080 (0.42%) AB; Antigua and Barbuda $13,824 (0.00%) YES; Argentina $9,122 (0.58%) YES; Armenia $4,125 (0.04%) NV; Australia $62,723 (0.33%) YES; Austria $53,859 (0.12%) YES; Azerbaijan $4,883 (0.13%) NV; Bahamas $30,070 (0.01%) YES; Bahrain $24,294 (0.02%) AB; Bangladesh $2,122 (2.11%) AB; Barbados $16,036 (0.00%) AB; Belgium $50,103 (0.15%) YES; Belarus $6,478 (0.12%) NO; Belize $3,970 (0.01%) AB; Benin $1,388 (0.16%) NV; Bhutan $3,296 (0.01%) AB; Bolivia $8,624 (0.15%) NO; Bosnia & Herzegovina $6,728 (0.04%) YES; Botswana $7,817 (0.03%) AB; Brazil $7,011 (2.73%) AB; Brunei $33,097 (0.01%) AB; Bulgaria $11,321 (0.09%) YES; Burkina Faso $876 (0.27%) NV; Burundi $265 (0.15%) NO; Cabo Verde $3,555 (0.01%) AB; Cambodia $1,720 (0.21%) AB; Cameroon $1,649 (0.34%) AB; Canada $49,222 (0.48%) YES; Central African Republic $552 (0.06%) NO; Chad $741 (0.21%) YES; Chile $15,617 (0.25%) YES; China $11,819 (18.47%) NO; Colombia $5,753 (0.65%) YES; Comoros $1,420 (0.01%) YES; Congo (Dem Republic of the) $588 (1.15%) YES; Congo (Republic Of) $2,505 (0.07%) NO; Costa Rica $11,806 (0.07%) YES; Cote d’Ivoire $2,567 (0.34%) YES; Croatia $16,247 0.05% YES; Cuba $8,822 (WB 2018) (0.15%) NO; Cyprus $29,551 (0.02%) YES; Czech Republic $25,732 (0.14%) YES; Denmark $67,218 (0.07%) YES; Djibouti $3,214 (0.01%) NV; Dominica $6,989 (0.00%) YES; Dominican Republic $7,951 (0.14%) YES; Ecuador $5,665 (0.23%) YES; Egypt $3,832 (1.31%) AB; El Salvador $4,031 (0.08%) AB; Equatorial Guinea $8,074 (0.02%) NV; Eritrea $625 (0.05%) NO; Estonia $26,470 (0.02%) YES; Eswatini $3,837 (WB 2019) (0.01%) AB; Ethiopia $952 (1.47%) NO; Fiji $5,069 (0.01%) YES; Finland $54,330 (0.07%) YES; France $44,995 (0.84%) YES; Gabon $8,601 (0.03) NO; Gambia $834 (0.03) AB; Georgia $4,361 (0.05%) YES; Germany $51,860 (1.07%) YES; Ghana $2,374 (0.40%) AB; Greece $19,673 (0.13%) YES; Grenada $9,171 (0.00%) YES; Guatemala $4,439 (0.23%) YES; Guinea $1,141 (0.17%) NV; Guinea-Bissau $888 (0.03%) AB; Guyana $9,192 (0.01%) AB; Haiti $1,943 (0.15%) YES; Honduras $2,586 (0.13%) YES; Hungary $18,075 (0.12%) YES; Iceland $65,273 (0.00%) YES; Ireland $94,556 (0.06%) YES; Israel $47,602 (0.11%) YES; Italy $33,190 (0.78%) YES; India $2,191 (17.7%) AB; Indonesia $4,256 (3.51%) AB; Iran $8,034 (1.08%) NO; Iraq $4,632 (0.52%) AB; Jamaica $5,328 (0.04%) YES; Japan $42,928 (1.62%) YES; Jordan $4,358 (0.13%) AB; Kazakhstan $9,828 (0.24%) NO; Kenya $2,129 (0.69%) AB; Kiribati $1,917 (0.00%) YES; Korea (Democratic Peoples Republic of [aka North Korea]) $640 (UN 2019) (0.33%) NO; Korea (Republic of [aka South Korea]) $34,866 (0.66%) YES; Kuwait $25,290 (0.05%) AB; Kyrgyzstan $1,123 (0.08%) NO; Lao (Peoples Democratic Republic of) $2,773 (0.09%) NO; Latvia $19,824 (0.02%) YES; Lebanon $2,802 (IMF 2020) (0.09%) NV; Lesotho $1,178 (0.03%) AB; Liberia $700 (0.06%) YES; Libya $3,617 (0.09%) YES; Liechtenstein $173,356 (WB 2017) (0.00%) YES; Lithuania $22,245 (0.03%) YES; Luxembourg $131,782 (0.01%) YES; Madagascar $521 (0.36%) AB; Malawi $432 (0.25%) YES; Malaysia $11,604 (0.42%) AB; Maldives $11,801 (0.01%) AB; Mali $983 (0.26%) NO; Malta $31,576 (0.01%) YES; Marshall Islands $4,206 (0.00%) YES; Mauritania $2,179 (0.06%) NV; Mauritius $9,639 (0.02%) YES; Mexico $9,246 (1.65%) AB; Micronesia (Federated States of) $3,821 (0.01%) YES; Moldova $4,638 (0.05%) YES; Monaco $185,741 (WB 2018) (0.00%) YES; Mongolia $4,172 (0.04%) AB; Montenegro $9,046 (0.01%) YES; Morocco $3,415 (0.47%) NV; Mozambique $425 (0.40%) AB; Myanmar $1,423 (0.7%) YES; Namibia $4,371 (0.03%) AB; Nauru $10,125 (0.00) YES; Nepal $1,236 (0.37) AB; Netherlands $58,003 (0.22%) YES; New Zealand $47,499 (0.06%) YES; Nicaragua $1,877 (0.08%) NO; Niger $633 (0.31%) AB; Nigeria $2,432 (2.64%) AB; North Macedonia $6,657 (0.03%) YES; Norway $81,995 (0.07%) YES; Oman $16,212 (0.07%) AB; Pakistan $1,260 (IMF 2020) (2.83%) AB; Palau $12,850 (0.00%) YES; Panama $13,690 (0.06%) YES; Papua New Guinea $2,737 (0.11%) YES; Paraguay $5,146 (0.09%) YES; Peru $6,678 (0.42%) YES; Philippines $8,646 (1.41%) YES; Poland $16,930 (0.49%) YES; Portugal $25,065 (0.13%) YES; Qatar $59,143 (0.04%) AB; Romania $14,968 (0.25%) YES; Russia $11,654 (1.87%) NO; Rwanda $821 (0.17%) NV; Saint Kitts and Nevis $14,402 (0.00%) AB; Saint Lucia $9,816 (0.00%) YES; Saint Vincent and the Grenadines $7,212 (0.00%) AB; San Marino $49,765 (0.00%) YES; Samoa $3,672 (0.00%) YES; Sao Tome and Principe $2,174 (0.00%) NV; Saudi Arabia $22,700 (0.45%) AB; Senegal $1,622 (0.21%) AB; Serbia $8,748 (0.11%) YES; Seychelles $9,666 (0.00%) YES; Sierra Leone $542 (0.10%) YES; Singapore $64,103 (0.08%) AB; Slovakia $21,529 (0.07%) YES; Slovenia $28,104 (0.03%) YES; Solomon Islands $2,455 (0.01%) NV; Somalia $347 (0.20%) NV; South Africa $5,444 (0.76%) AB; South Sudan $315 (0.14%) AB; Spain $30,996 (0.60%) YES; Sri Lanka $3,830 (0.27%) AB; Sudan $787 (0.56%) AB; Suriname $4,030 (0.01%) AB; Sweden $58,997 (0.13%) YES; Switzerland $94,696 (0.11%) YES; Syria $2,807 (IMF 2010) (0.22%) NO; Tajikistan $810 (0.12%) NO; Tanzania (United Republic of) $1,104 (0.77%) AB; Thailand $7,702 (0.90%) AB; Timor-Leste $1,285 (0.02%) YES; Togo $1,016 (0.11%) AB; Tonga $5,081 (0.00%) YES; Trinidad-Tobago $15,752 (0.02%) AB; Tunisia $3,683 (0.15%) AB; Turkey $9,327 (1.08%) YES; Turkmenistan $9,032 (0.08%) NV; Tuvalu $5,116 (0.00%) YES; Uganda $972 (0.59%) AB; Ukraine $3,984 (0.56%) YES; United Arab Emirates $35,171 (0.13%) AB; United Kingdom $46,344 (0.87%) YES; United States $68,309 (4.25%) YES; Uruguay $15,653 (0.04%) Yes; Uzbekistan $1,775 (0.43%) No; Vanuatu $2,957 (0.00%) AB; Venezuela $1,542 (0.36%) NV; Vietnam $3,609 (1.25%) NO; Yemen $754 (0.38%) AB; Zambia $974 (0.24%) NV; Zimbabwe $1,684 (0.19%) NO.
Appendix 2: “Countries of Color” (142)
Afghanistan; Algeria; Angola; Antigua and Barbuda; Argentina; Azerbaijan; Bahamas, Bahrain, Bangladesh; Barbados; Belize; Benin; Bhutan; Bolivia; Botswana; Brazil; Brunei; Burkina Faso; Burundi; Cabo Verde; Cambodia; Cameroon; Central African Republic; Chad; Chile; China; Colombia; Comoros; Congo (Democratic Republic of the); Congo (Republic of); Costa Rica; Cote d’Ivoire (Ivory Coast); Cuba; Djibouti; Dominica; Dominican Republic; Ecuador; Egypt; El Salvador; Equatorial Guinea; Eritrea; Eswatini; Ethiopia; Fiji; Gabon; Gambia; Ghana; Grenada; Guatemala; Guinea; Guinea-Bissau; Guyana; Haiti; Honduras; India; Indonesia; Iran; Iraq; Jamaica; Japan; Jordan; Kazakhstan; Kenya; Kiribati; Korea (Democratic People’s Republic of); Korea (Republic of); Kuwait; Kyrgyzstan; Lao (Peoples Democratic Republic of); Lebanon; Lesotho; Liberia; Libya; Madagascar; Malawi; Malaysia; Maldives; Mali; Marshall Islands; Mauritania; Mauritius; Mexico; Micronesia (Federated States of); Mongolia; Morocco; Mozambique; Myanmar; Namibia; Nauru; Nepal; Nicaragua; Niger; Nigeria; Oman; Pakistan; Palau; Panama; Papua New Guinea; Paraguay; Peru; Philippines; Qatar; Rwanda; Saint Kitts and Nevis; Saint Lucia; Saint Vincent and the Grenadines; Samoa; Sao Tome and Principe; Saudi Arabia; Senegal; Seychelles; Sierra Leone; Singapore; Solomon Islands; Somalia; South Africa; South Sudan; Sri Lanka; Sudan; Suriname; Syria; Tajikistan; Tanzania (United Republic of); Thailand; Timor-Leste; Togo; Tonga; Trinidad and Tobago; Tunisia; Turkey; Turkmenistan; Tuvalu; Uganda; United Arab Emirates; Uruguay; Uzbekistan; Vanuatu; Venezuela; Vietnam; Yemen; Zambia; Zimbabwe.
1 Resolution adopted by the General Assembly on 7 April 2022 ES-11/3. “Suspension of the rights of membership of the Russian Federation in the Human Rights Council [Excerpt:] Expressing grave concern at the ongoing human rights and humanitarian crisis in Ukraine, in particular at the reports of violations and abuses of human rights and violations of international humanitarian law by the Russian Federation, including gross and systematic violations and abuses of human rights, recognizing the strong expressions of concern in statements by the Secretary-General and by the United Nations High Commissioner for Human Rights, and noting the latest update on the human rights situation in Ukraine by the human rights monitoring mission in Ukraine, of 26 March 2022, [par.] 1. Decides to suspend the rights of membership in the Human Rights Council of the Russian Federation…”
2 Resolution adopted March 2 by the General Assembly: “Deplores in the strongest terms the aggression by the Russian Federation against Ukraine in violation of Article 2 (4) of the Charter.” (Article 2 (4) reads: “All Members shall refrain in their international relations from the threat or use of force against the territorial integrity or political independence of any state, or in any other manner inconsistent with the Purposes of the United Nations.”) The resolution also “[d]eplores the 21 February 2022 decision by the Russian Federation related to the status of certain areas of the Donetsk and Luhansk regions of Ukraine as a violation of the territorial integrity and sovereignty of Ukraine and inconsistent with the principles of the Charter.” Beyond Russia, the resolution “[d]eplores the involvement of Belarus in this unlawful use of force against Ukraine, and calls upon it to abide by its international obligations.”
3 This article will concentrate on the April 7 vote. I wrote about the March 2 vote in Divided World: The UN Condemnation of Russia is Endorsed by Countries Run by the Richest, Oldest, Whitest People on Earth But Only 41% of the World’s Population, found here, here, here, here.
4 Another March 24 resolution passed in the UNGA blamed Russia for the humanitarian situation in Ukraine. It received a vote nearly identical to the March 2 vote.
5 These figures and similar ones throughout this article are the sums of the share of global population for each country in each voting category.
6 Two Appendices follow this article. Appendix 1 lists the 193 countries on the April 7 UNGA roster, each followed by its nominal GDP per capita, its % share of world population, and how it voted. Appendix 2 lists, for the purpose of this article, “countries of color.” (All other countries will be considered “white countries.”)
7 My source gives population share figures out to two decimals. This overlooks populations of a number of very small countries, adding up to 1.2% of world population. Assuming the distribution of “poorer” and “richer” countries is roughly similar in that 1.2%, I approximated the “poorer”/“richer” split as 85%/15% and assigned 85% of the 1.2% to the “poorer” group and the rest to the “richer” group. “Richer countries” have 14.93% of world population; “poorer countries” have 83.87%. Distributing the remaining 1.2% of world population according to an 85%/15% split (“poorer”/“richer”), means “poorer” countries have 84.89% of world population and “richer” countries have 15.11%. This rounds to 85% and 15%. I used the same method to find the percentages for “countries of color” and “white countries” (below). Because of these vagaries, among the many statistics given below, some may be off by a percentage point.
8 Some name a semi-periphery that may include Russia and China.