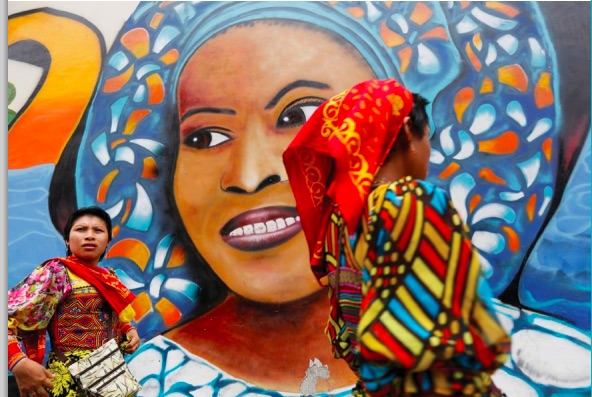
. DEMOCRATIC PARTICIPATION .
From a report by Inter-Parliamentary Union (excerpts)
The past 20 years have witnessed an impressive rise in the share of women in national parliaments around the world, with the global average nearly doubling during that time – and all regions making substantial progress towards the goal of 30 per cent women in decision making.

In 1995, delegates to the United Nations (UN) Fourth World Conference on Women unanimously signed the Beijing Platform for Action. Described as a “new agenda for women’s empowerment,” its mission statement called for the removal of all “obstacles to women’s active participation in all spheres of public and private life”. The Platform set a 30 per cent target for women in decision-making, to be achieved through a wide range of strategies, including positive action, public debate, and training and mentoring for women as leaders.
Over the last 20 years, countries around the world have made substantial progress towards this 30 per cent goal. The global average of women in national parliaments has nearly doubled, from 11.3 per cent in 1995 to 22.1 per cent in 2015 (+10.8 points). 2014, however, saw little progress in the percentage of women in national parliaments worldwide, with the global average rising only by 0.3 points, begging the question: have we reached the glass ceiling?
Global highlights
• Worldwide, women’s average share of parliamentary membership nearly doubled between 1995 and 2015, from 11.3 per cent in 1995 to 22.1 per cent in 2015. Their share gained ground in almost 90 per cent of the 174 countries for which 1995 and 2015 data are available.
• Over the same period, the number of single and lower houses with more than 30 per cent women parliamentarians grew from five to 42, and those with more than 40 per cent from one to 13. By 2015, four houses of parliament surpassed the 50 per cent threshold, one moving beyond 60 per cent women parliamentarians.
• The world’s highest ranking countries have become more diverse: the top 10, dominated by eight European countries in 1995, now include four in Sub-Saharan Africa and three each in the Americas and Europe.
• Far fewer single and lower houses elect less than 10 per cent women, dropping from 109 in 1995 to 38 in 2015. The number of all-male single and lower houses fell from 10 to five.
• In addition to shifting political circumstances, a crucial factor driving these changes has been the adoption of electoral gender quotas, which have spread from a small number of States in 1995 to more than 120 in 2015.
• After notable increases in recent years, growth in women’s average share of parliaments worldwide levelled off in 2014, rising only 0.3 points to 22.1 per cent. Women won 2147 of the 10,265 seats up for election or renewal in 2014. .
The impact of women in parliament
Scholarly studies, supported by interviews with male and female parliamentarians in the IPU Equality in Politics survey, indicate that women’s presence has changed parliaments around the world in tangible ways. New issues like violence against women or women’s health concerns, which might not otherwise have received the attention they deserve, are making it onto the political agenda. Women in parliament also contribute, at least in some contexts, to a more collaborative political environment, both within and across parties. Their presence emboldens more women citizens to contact their representatives, enhancing democratic communication and accountability.
(Click here for a french version of this article.)
Women in parliaments. Do they enhance democratic communication and accountability?
Editor’s comment: The latest statistics on percentages of women in parliaments have been posted by IPU on their website. Here are the top fifteen:
Rwanda 63.8%
Bolivia 53.1%
Cuba 48.9%
Seychelles 43.8%
Sweden 43.6%
Senegal 42.7%
South Africa 41.9%
Ecuador 41.6%
Finland 41.5%
Iceland 41.3%
Namibia 41.3%
Nicaragua 41.3%
Spain 41.1%
Mozambique 39.6%
Norway 39.6%
The permanent members of the Security Council are far down the list:
36: United Kingdom 29.4%
44: France 26.2%
54: China 23.6%
71: United States 19.4%
95: Russian Federation 13.6%
Readers’ comments are invited on this question.